
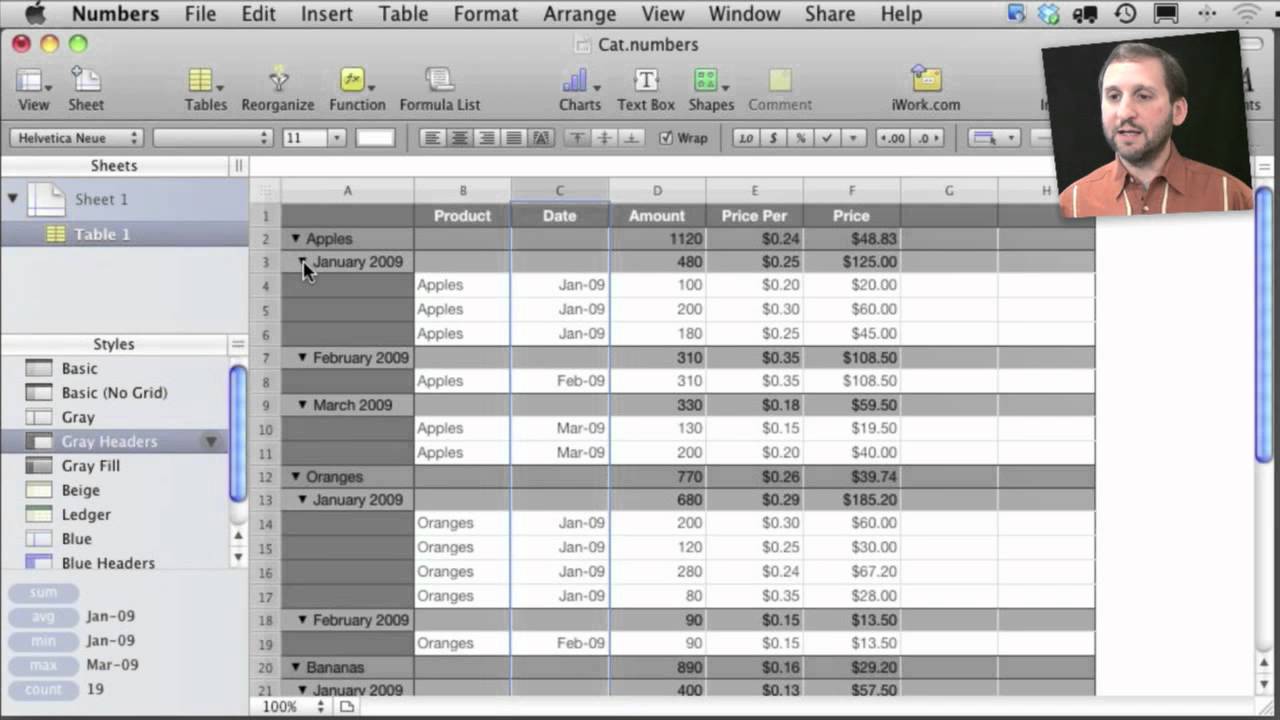
While iWork Numbers doesn't have true pivot tables, you can get similar results using Table Categories. This feature lets you group data together in various ways to reveal the same summaries that you can get with pivot tables.
▶ You can also watch this video at YouTube.
▶
▶ Watch more videos about related subjects: iWork (42 videos), Numbers (210 videos).
▶
▶ Watch more videos about related subjects: iWork (42 videos), Numbers (210 videos).


Cool. Never knew about this at all. Thanks.
Hello Gary,
tanx a lot for your videos, i think there are thousands of new things hidden in Mac, ;)
Gary, there is a problem which i could not find a solution for that yet, how can one uninstall the software updates of the programs which are uninstalled, as you know sometimes we want to try a software and some updates will be installed with it and after we uninstall the software, the updates are still there, is it a way to uninstall them?
should we also uninstall our previous updates, e.g. the the very old Itunes updates?
Cheers
MG
Any updates you install to a piece of software should be uninstalled when you uninstall the software.
Are you talking about the update installer file that you downloaded? In your Downloads folder? You can throw that away as soon as the update is applied.
But for iTunes, that is all handled by Mac OS X Software update, You shouldn't have any files left over from that. Are you seeing some files? If so, what?
Hi Gary,
Thanks for your reply,
About my first question, you are right, as i uninstalled them (Fire Fox and Microsoft), they were also gone, but about my second question, i am talking about the Mac programs (like iWork or Safari), i see them in System Preferences> Soft Ware update, by the tab: Installed Software...
I found that there are some updates of the Old version of iTunes or the iWork 09 that i used to have or some other stuff, as i see i can not change or delete them, is it so?
Are these necessary for the Mac or should be deleted?
Cheers
MG
I believe what you are looking at is a log of the updates installed. They are not the installers themselves. Just leave those alone.
thank so much. i hope iWork developers will continue adding more similar excel functions. the table category is much easier to understand than the pivot table in excel. you can't just teach pivoting to anybody using excel they end up messing with the data causing error. :)
hi Gary!
thanks a lot for the video!!
i just want to know, i have a great amount of data, and most of them are different from each other, how can i create like an interval for example, to add all the data from 20 to 30, another from 40 to 50, and so on, to make an statistic analysis and create a graphic ??
I'm not quite sure what you are looking for. But perhaps consulting a spreadsheet expert is the way to go.
Create a column next to those numbers and divide by ten and round to whole number.
In excel you would pivot using that column (e.g. there might be ten 1's then ten 2's etc) and get count, sum,average or whatever you choose.
Perhaps using a similar technique in numbers it might work for you?
Great explanation. Very important for the switchers coming from Excel.
It is not exactly the same as pivot tables have a little more filters, but I 'll start working with numbers and I'll see what I'm able to do.
Thaknks for sharing it.
Is there any way to chart the category summary data?
Maybe. Did you try it by just selecting those cells and charting them?
Outstanding. Thank you so much!
super awesome cool! Just what I needed, just in time.
Gary, thank you for another informative and well explained video on pivot tables within Numbers. I am hoping that you can help with this question: when I try to categorize my data I am not getting subtotals by each category. All of the data is collected very nicely by category, but no totals are showing. Any idea as to why this would happen?
Thank you.
Hard for me to say without being there. Play around with it. Experiment.
Really nice video. This is really simple and easy to use :-)
Thanks.
Great solution for emulating pivot tables in Numbers. Is there a way to do this in iOS Numbers? I do not see a Categorize Menu Selection. If not, do you know if there is a user group for iOS Numbers? We want to use Numbers on the iPad to read our data on the road. Great Job, Thank You!
Not sure how/if this can be done in Numbers for iOS. Apple's discussions section has forums.
The average function is not correct. All it does is take each row add it up and divide by number of rows... in this example you have different price per units.
if we add up each price and divide by 6 we get the .24... however this is not the true price per unit
The true price per unit is 293.00 divided by 1120 which yeilds .26...
my question is how do we add a header for this ... it can be done with excel with tables but not in numbers
The average function isn't what you want for this. You want a simple formula: get the sum of one column and divide it by the sum of the other, for instance -- not sure on the exact formula for your situation, but I'm sure you can figure it out.
Thanks for giving me quick, accessible well organized information!